Working with the ECCC Climate Daily API
Compute climate indicators on weather station data from the ECCC API
Environment and Climate Change Canada (ECCC) offers an API to access daily weather station data. This notebook focus is on converting the JSON response from the server to an xarray.Dataset. At that point, it’s then easy to compute numerous climate indicators on the daily time series using xclim.
# NBVAL_IGNORE_OUTPUT

import os
import warnings
from urllib.parse import urlencode, urljoin
from urllib.request import urlopen

os.environ["USE_PYGEOS"] = "0"  # force use Shapely with GeoPandas

import numba

warnings.simplefilter("ignore", category=numba.core.errors.NumbaDeprecationWarning)

import cf_xarray as cfxr
import geopandas as gpd

# Compose the request
host = "https://api.weather.gc.ca/"
api = urljoin(host, "collections/climate-daily/items/")
query = {
    "datetime": "1840-03-01 00:00:00/2021-06-02 00:00:00",
    "STN_ID": "10761",
    "sortby": "LOCAL_DATE",
}
url = f"{api}?{urlencode(query)}"


# Use geopandas to convert the json output to a GeoDataFrame.
with urlopen(url=str(url)) as req:
    gdf = gpd.read_file(filename=req, engine="pyogrio")
gdf.sort_index().head()
ERROR 1: PROJ: proj_create_from_database: Open of /home/tjs/miniforge3/envs/pavics-sdi/share/proj failed
| id | TOTAL_SNOW | COOLING_DEGREE_DAYS | HEATING_DEGREE_DAYS_FLAG | ID | MAX_TEMPERATURE | CLIMATE_IDENTIFIER | TOTAL_PRECIPITATION | MEAN_TEMPERATURE_FLAG | MIN_REL_HUMIDITY | ... | MEAN_TEMPERATURE | TOTAL_RAIN_FLAG | HEATING_DEGREE_DAYS | LOCAL_DAY | MAX_REL_HUMIDITY | SNOW_ON_GROUND_FLAG | MAX_TEMPERATURE_FLAG | MIN_TEMPERATURE | LOCAL_MONTH | geometry | |
|---|---|---|---|---|---|---|---|---|---|---|---|---|---|---|---|---|---|---|---|---|---|
| 0 | 7024745.1994.7.26 | None | 4.0 | None | 7024745.1994.7.26 | 26.7 | 7024745 | 4.5 | None | NaN | ... | 22.0 | M | 0.0 | 26 | NaN | None | None | 17.3 | 7 | POINT (-73.57917 45.50474) |
| 1 | 7024745.1994.7.27 | None | 1.6 | None | 7024745.1994.7.27 | 23.5 | 7024745 | 1.2 | None | NaN | ... | 19.6 | M | 0.0 | 27 | NaN | None | None | 15.6 | 7 | POINT (-73.57917 45.50474) |
| 2 | 7024745.1994.7.28 | None | 1.1 | None | 7024745.1994.7.28 | 21.2 | 7024745 | 0.0 | None | NaN | ... | 19.1 | M | 0.0 | 28 | NaN | None | None | 17.0 | 7 | POINT (-73.57917 45.50474) |
| 3 | 7024745.1994.7.29 | None | 3.7 | None | 7024745.1994.7.29 | 27.0 | 7024745 | 0.0 | None | NaN | ... | 21.7 | M | 0.0 | 29 | NaN | None | None | 16.4 | 7 | POINT (-73.57917 45.50474) |
| 4 | 7024745.1994.7.30 | None | 2.9 | None | 7024745.1994.7.30 | 23.7 | 7024745 | 1.2 | None | NaN | ... | 20.9 | M | 0.0 | 30 | NaN | None | None | 18.0 | 7 | POINT (-73.57917 45.50474) |
5 rows × 36 columns
The next step is to convert the GeoDataFrame object into an xarray.Dataset, to do so, we’ve created some utilities packaged in cf-xarray to convert point geometries (the stations’ locations) into CF-compliant coordinates. The function below bundles a number of operations to prepare the data for further analysis.
def preprocessing(gdf):
    """Convert geojson data from the ECCC weather API into a CF-compliant dataset.

    - Rename variables names CF standard names
    - Assign units to variables
    - Mask values with a flag
    - Convert wind directions in tens of degrees to degrees
    - Fill gaps in time series with NaNs

    Parameters
    ----------
    gdf : pandas.GeoDataFrame
        Data from the `api.weather.gc.ca` service.

    Returns
    -------
    xr.Dataset
        Dataset complete with units and CF-compliant temporal and spatial coordinates.

    Notes
    -----
    DIRECTION_MAX_GUST is only reported if the maximum gust speed exceeds 29 km/h.
    A value of 0 or 360 means wind blowing from the geographic north, and 90 from the east.

    """
    import pandas as pd
    import xarray as xr

    # Convert timestamp to datetime object
    gdf["time"] = gdf["LOCAL_DATE"].astype("datetime64[ns]")

    # Drop useless variables
    gdf = gdf.drop(["LOCAL_DATE", "LOCAL_YEAR", "LOCAL_MONTH", "LOCAL_DAY"], axis=1)

    # Convert to xarray.Dataset
    ds = gdf.set_index("time").to_xarray()

    # Add a grid mapping for geometries
    ds.geometry.attrs["grid_mapping"] = "longitude_latitude"

    # Convert geometries to CF - creates a features dimension
    ds = cfxr.geometry.reshape_unique_geometries(ds)
    coords = cfxr.shapely_to_cf(ds.geometry)
    coords = coords.drop_vars(["geometry_container", "x", "y"])
    ds = xr.merge([ds.drop_vars("geometry"), coords])

    # Rename `features` dimension to `station`
    ds = ds.rename(features="station")

    # Mask values with a flag then drop flag variable
    for key in ds.data_vars:
        if key.endswith("_FLAG"):
            valid = ds[key].isnull()
            name = key.replace("_FLAG", "")
            ds[name] = ds[name].where(valid)
            ds = ds.drop_vars(key)

    # Convert wind gust from tens of degrees to degrees
    if "DIRECTION_MAX_GUST" in ds.data_vars:
        ds["DIRECTION_MAX_GUST"] *= 10

    # Assign units to variables
    # TODO: Add long_name and description from https://climate.weather.gc.ca/glossary_e.html
    attrs = {
        "MEAN_TEMPERATURE": {
            "units": "degC",
            "standard_name": "air_temperature",
            "cell_methods": "time: mean within days",
        },
        "MIN_TEMPERATURE": {
            "units": "degC",
            "standard_name": "air_temperature",
            "cell_methods": "time: min within days",
        },
        "MAX_TEMPERATURE": {
            "units": "degC",
            "standard_name": "air_temperature",
            "cell_methods": "time: max within days",
        },
        "TOTAL_PRECIPITATION": {
            "units": "mm/day",
            "standard_name": "precipitation_flux",
        },
        "TOTAL_RAIN": {
            "units": "mm/day",
        },
        "TOTAL_SNOW": {"units": "mm/day", "standard_name": "solid_precipitation_flux"},
        "SNOW_ON_GROUND": {"units": "cm", "standard_name": "surface_snow_thickness"},
        "DIRECTION_MAX_GUST": {
            "units": "degree",
            "standard_name": "wind_gust_from_direction",
        },
        "SPEED_MAX_GUST": {
            "units": "km/h",
            "standard_name": "wind_speed_of_gust",
            "cell_methods": "time: max within days",
        },
        "COOLING_DEGREE_DAYS": {"units": "degC days"},
        "HEATING_DEGREE_DAYS": {"units": "degC days"},
        "MIN_REL_HUMIDITY": {
            "units": "%",
            "standard_name": "relative_humidity",
            "cell_methods": "time: min within days",
        },
        "MAX_REL_HUMIDITY": {
            "units": "%",
            "standard_name": "relative_humidity",
            "cell_methods": "time: max within days",
        },
    }

    for key in ds.data_vars:
        ds[key].attrs.update(attrs.get(key, {}))

    # Try to squeeze arrays of identical values along the time dimension
    for key in ["STATION_NAME", "CLIMATE_IDENTIFIER", "PROVINCE_CODE"]:
        ds[key] = squeeze_if_unique(ds[key], "time")

    # Reindex over continuous time series
    ts = pd.date_range(ds.time[0].values, ds.time[-1].values)
    return ds.reindex(time=ts)


def squeeze_if_unique(da, dim):
    """Squeeze dimension out of DataArray if all values are identical or masked.

    If a value is replicated along the time dimension, this function will return a
    DataArray defined only over the dimensions where values vary. If the resulting
    object is a scalar, it is converted to a global attribute.

    Parameters
    ----------
    da : xr.DataArray
        Input values.
    dim : str
        Dimension to squeeze if possible.
    """
    import numpy as np

    def n_unique(arr):
        return len(set(np.unique(arr)) - {""})

    if da.dtype == object:
        # Check if possible to squeeze along `dim`
        n = np.apply_along_axis(
            n_unique,
            da.get_axis_num(dim),
            da.fillna("").values,
        )

        if (n == 1).all():
            return da.max(dim)  # Should avoid returning the null value.

        return da

    # else : int, float or datetime
    da_filled = da.ffill(dim).bfill(dim)
    if (da_filled.isel({dim: 0}) == da_filled).all():
        return da_filled.isel({dim: 0}, drop=True)

    return da
# NBVAL_IGNORE_OUTPUT


# Convert the GeoDataFrame to a xarray.Dataset
# Different stations are aligned along the `station` dimension
ds = preprocessing(gdf)
ds
<xarray.Dataset>
Dimensions:              (station: 1, time: 1061)
Coordinates:
  * station              (station) int64 0
  * time                 (time) datetime64[ns] 1994-07-26 ... 1997-06-20
    lon                  (station) float64 -73.58
    lat                  (station) float64 45.5
Data variables: (12/18)
    id                   (station, time) object '7024745.1994.7.26' ... '7024...
    MIN_TEMPERATURE      (station, time) float64 17.3 15.6 17.0 ... 15.7 15.6
    MIN_REL_HUMIDITY     (station, time) float64 nan nan nan ... 78.0 38.0 35.0
    DIRECTION_MAX_GUST   (station, time) float64 0.0 0.0 0.0 0.0 ... 0.0 0.0 0.0
    CLIMATE_IDENTIFIER   (station) object '7024745'
    STATION_NAME         (station) object 'MCTAVISH'
    ...                   ...
    HEATING_DEGREE_DAYS  (station, time) float64 0.0 0.0 0.0 0.0 ... 0.8 0.0 0.0
    TOTAL_RAIN           (station, time) object nan nan nan nan ... nan nan nan
    PROVINCE_CODE        (station) object 'QC'
    SNOW_ON_GROUND       (station, time) object None None None ... None None
    MAX_TEMPERATURE      (station, time) float64 26.7 23.5 21.2 ... 25.0 25.9
MAX_REL_HUMIDITY (station, time) float64 nan nan nan ... 98.0 99.0 74.0Computing climate indicators
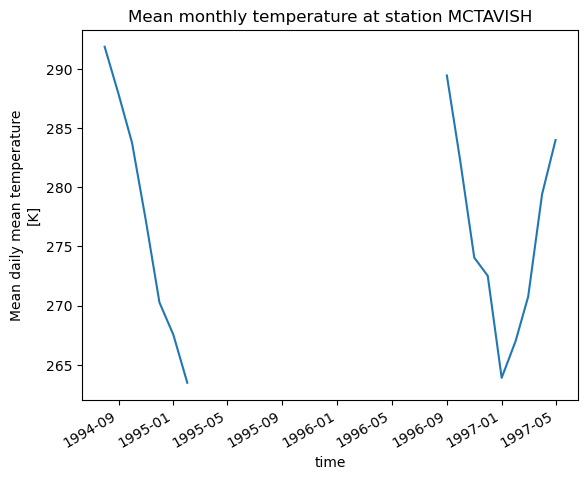
In the next cell, we compute the monthly mean temperature from the daily observations. By default, xclim is very strict about missing values, marking any month with one missing value as entirely missing. Here we’ll use the WMO recommendation for missing data, where a month is considered missing if there are 11 days or more missing, or 5 consecutive missing values.
import xclim

with xclim.set_options(check_missing="wmo"):
    mtas = xclim.atmos.tg_mean(ds.MEAN_TEMPERATURE, freq="MS")
from matplotlib import pyplot as plt

name = ds.STATION_NAME.isel(station=0).values
mtas.isel(station=0).plot()
plt.title(f"Mean monthly temperature at station {name}")
plt.show()