Gridded Data Renderer
PAVICS uses THREDDS WMS service to render netCDF data on a map canvas. The WMS GetMap operation passers the layer identification (<variable name>), styles, figure size and format, projection and color range and the server returns an image that can be displayed in a figure or a map canvas.
from IPython.display import Image
from owslib.wms import WebMapService

server = "https://pavics.ouranos.ca/twitcher/ows/proxy/thredds/"
path = "/birdhouse/testdata/flyingpigeon/cmip5/tasmax_Amon_MPI-ESM-MR_rcp45_r2i1p1_200601-200612.nc"
wms = WebMapService(f"{server}wms{path}", version="1.3.0")
resp = wms.getmap(
    layers=["tasmax"],
    format="image/png",
    colorscalerange="250,350",
    size=[256, 256],
    srs="CRS:84",
    bbox=(150, 30, 250, 80),
    time="2006-02-15",
    transparent=True,
)
Image(resp.read())
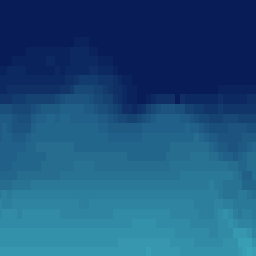
One issue with the figure above is the colorscale range and the colormap, which do not provide a lot of contrast. So lets get a copy of the data using the OPeNDAP protocol to find the actual minimum and maximum values.
(235.5495147705078, 306.79168701171875)
Now we’ll simply pass those min/max to getmap with the colorscalerange parameter, and change the palette in the same go using the styles parameter. The supported styles are stored in the layer’s metadata.
sorted(wms.contents["tasmax"].styles.keys())
['colored_contours/default',
 'contours',
 'default-scalar/default',
 'raster/default']
resp = wms.getmap(
    layers=["tasmax"],
    styles=["default-scalar/default"],
    format="image/png",
    colorscalerange=f"{mn},{mx}",
    size=[256, 256],
    srs="CRS:84",
    bbox=(150, 30, 250, 80),
    time="2006-02-15",
    transparent=True,
)
Image(resp.read())